Market Fears Subside as Volatility Index (VIX) Tumbles from Morning Highs, Signaling Investor Confidence

CHICAGO, IL – The stock market’s “fear index,” the CBOE Volatility Index (VIX), retreated significantly today after a brief morning spike, signaling a return of calm and confidence among investors. The index fell to 16.72, a decline of 0.65%, indicating that expectations for near-term market turbulence are diminishing.
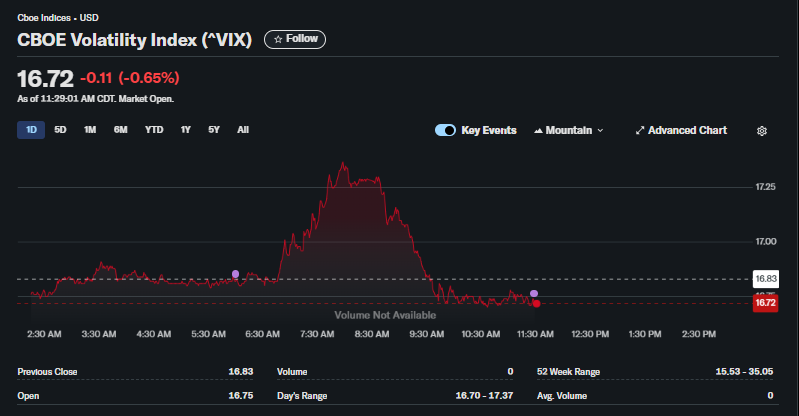
The trading session began with a notable surge in anxiety. The VIX jumped to a day’s high of 17.37 in pre-market trading, suggesting that investors were bracing for a potentially rocky open. However, as the market opened and found its footing, those fears quickly evaporated. The index reversed course sharply, falling back to the lower end of its daily range.
This decline in the VIX is a classic “good news” signal for the stock market. The index measures the market’s expectation of 30-day volatility based on S&P 500 index options. A lower VIX value generally corresponds with less fear and is often associated with a stable or rising stock market. The drop from the morning peak suggests that any initial investor concerns were resolved, paving the way for a more constructive trading environment.
Looking at the broader picture, the current level of 16.72 sits comfortably in the lower portion of its 52-week range of 15.53 – 35.05. Historically, VIX levels below 20 are considered to represent a low-volatility, low-fear market environment. The swift rejection of the morning’s higher levels reinforces the prevailing sentiment of market stability.
For traders and long-term investors alike, the subsiding CBOE Volatility Index provides a welcome sign of confidence, suggesting that the path of least resistance for equities may be to the upside in the near term.
Frequently Asked Questions (FAQ) about the CBOE Volatility Index (VIX)
Here are detailed answers to the most common questions about the VIX based on the provided data.
1. What is the CBOE Volatility Index (VIX)?
The VIX is a real-time index that represents the market’s expectations for the relative strength of near-term price changes in the S&P 500 Index (SPX). In simple terms, it measures expected stock market volatility over the next 30 days.
2. What is the current value of the VIX?
As of 11:29:01 AM CDT, the value of the VIX was 16.72.
3. Why is the VIX often called the “fear index”?
It is called the “fear index” because it typically spikes higher when the stock market falls sharply and investor fear is rising. Conversely, it tends to fall when the market is stable or rising and investors are confident.
4. Is a low or falling VIX good or bad for the stock market?
A low or falling VIX is generally considered good news for the stock market. It signals that investors anticipate less turbulence and are less fearful, which often correlates with rising stock prices.
5. What happened with the VIX today?
The VIX experienced a “spike-and-fade” pattern. It surged to a high of 17.37 before the market opened and then fell sharply to a low of 16.70 as the trading session progressed.
6. What does the drop in the VIX from its morning high suggest?
It suggests that initial fears or uncertainties at the start of the day were quickly resolved. Investors became more confident, leading to a decrease in expected volatility.
7. What is the ticker symbol for the VIX?
The commonly used ticker symbol for the CBOE Volatility Index is ^VIX.
8. Can you buy or sell the VIX directly?
No, you cannot invest directly in the VIX itself because it is an index—a mathematical calculation. However, you can trade financial products based on the VIX, such as VIX futures, options, and various exchange-traded funds (ETFs) and notes (ETNs).
9. What was the day’s trading range for the VIX?
The trading range for the day, up to the time of the image, was between 16.70 and 17.37.
10. What is the 52-week range for the VIX?
The 52-week range is 15.53 to 35.05. The current level of 16.72 is near the low end of this range, indicating a period of relatively low market anxiety compared to the past year.
11. Why is there no trading volume shown for the VIX?
Because the VIX is an index and not a security that can be bought or sold, it does not have a trading volume. The volume for VIX-related products (like the VXX or UVXY ETFs) is tracked separately.
12. How does the VIX relate to the S&P 500?
The VIX has a strong inverse correlation with the S&P 500. When the S&P 500 goes up, the VIX usually goes down. When the S&P 500 goes down, the VIX usually goes up.