CHICAGO – The CBOE Volatility Index (^VIX), the market’s primary gauge of investor fear, is on the rise in early trading, suggesting a growing sense of uncertainty across the stock market. As of 9:13 AM CDT, the VIX was trading at 17.67, up 1.09% for the session.
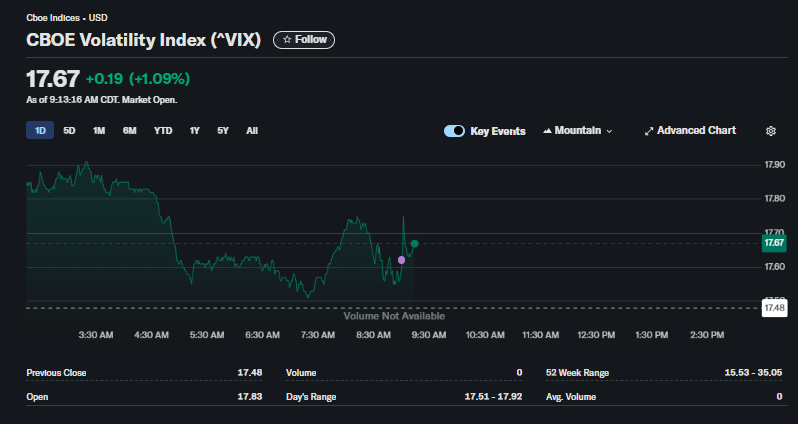
The VIX, which typically has an inverse relationship with the S&P 500, saw a volatile start to the day. After opening higher at 17.83, it has traded within a range of 17.51 to 17.92. The one-day chart shows a clear upward trend since the pre-market session, with a notable spike after the market opened. This increase in the VIX indicates that traders are pricing in a greater potential for stock market swings over the next 30 days.
When the VIX rises, it often signals that investors are buying more put options to hedge their portfolios against a potential stock market decline. The current level, while not in panic territory (typically considered above 30), shows a move away from the complacency seen in recent weeks.
How Should Investors Interpret the Rising VIX?
It is not possible to buy or sell the VIX index directly as it is not a stock. However, its movement provides crucial signals for how investors might want to position their portfolios.
-
For General Investors: A rising VIX is a call for caution. It suggests that downside risk in the stock market is increasing. Investors may want to review their portfolios for risk exposure, ensuring they are not overly allocated to highly volatile stocks. This could be a time to consider more defensive sectors.
-
For Active Traders: The increase in volatility can create opportunities. Some advanced traders use VIX-related financial products (like ETFs/ETNs or options) to hedge their portfolios or speculate on future volatility. A rising VIX might lead traders to anticipate a short-term drop in major stock indices like the S&P 500.
Our Opinion on the Market’s Volatility
The current VIX level of 17.67 is still historically moderate. However, the upward trajectory during the trading session is the key takeaway. It suggests that the market’s calm may be getting disrupted. The previous day’s close was 17.48, and the index is now firmly above that level.
Investors should monitor the VIX closely throughout the day. If it continues to climb and breaks above the daily high of 17.92, it could signal further weakness for stocks. Conversely, if the VIX reverses and falls, it would likely correspond with a rally in the broader stock market. For now, the signal is one of heightened alert.
Frequently Asked Questions (FAQ) about the VIX
1. What is the CBOE Volatility Index (^VIX)?
The VIX is a real-time index that represents the market’s expectations for the relative strength of near-term price changes of the S&P 500 index. It is often called the “fear index” because it tends to rise when the stock market falls and investors are fearful.
2. Can I buy the VIX like a stock?
No, you cannot buy or sell the VIX index directly. However, there are exchange-traded funds (ETFs) and notes (ETNs), as well as futures and options, whose value is based on the VIX. These are complex financial instruments and are typically used by experienced traders.
3. What does a rising VIX mean for my stock portfolio?
A rising VIX generally indicates that stock market volatility is increasing, and it often coincides with falling stock prices. It’s a signal for investors to be more cautious and review the risk level of their holdings.
4. What are considered high and low levels for the VIX?
-
Below 20: Generally indicates low volatility and market complacency.
-
20 to 30: Represents a normal or moderate level of volatility.
-
Above 30: Signals high volatility and significant investor fear or uncertainty.
The 52-week range for the VIX is 15.53 – 35.05, showing it has moved between low and high fear levels over the past year.
5. What has been the VIX’s trading range today?
As of the time of the screenshot, the VIX has traded in a range between 17.51 and 17.92.
6. Why is the VIX green (up) if it signals fear?
The color coding represents its price movement for the day, just like a stock. Green means its value has increased from the previous day’s close, and red means it has decreased. In the case of the VIX, an increase (green) means fear or expected volatility is rising.