
The S&P 500 index, a key barometer for the overall U.S. stock market, started the trading day on a negative note, retreating from levels near its 52-week high and signaling a cautious tone among investors.
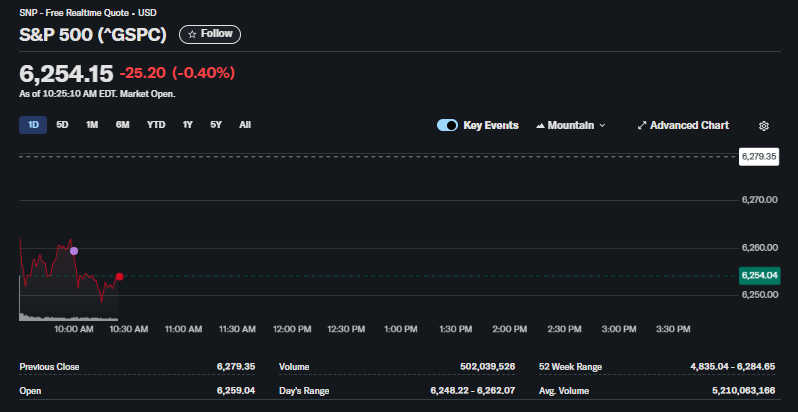
As of 10:25:10 AM EDT, the broad market index was at 6,254.15, down 25.20 points or -0.40%. The index opened at 6,259.04, below its previous close of 6,279.35, which was very close to its 52-week peak of 6,284.65.
The intraday chart shows that after the market opened, the index saw an initial attempt to rally which was quickly met with selling pressure. It then trended downwards, setting an intraday low of 6,248.22. This price action suggests that sellers have been more dominant in the first hour of trading, possibly as some investors lock in profits following the market’s recent strong performance.
Market Sentiment: A Time for Caution or Opportunity?
The current dip in the S&P 500 presents different interpretations for investors based on their outlook and strategy:
-
Bearish/Cautious View: The inability of the market to hold its opening level and the subsequent decline could be interpreted as a sign of short-term weakness. Investors who are cautious may see this as a signal to take some profits or hedge their portfolios, especially given that the market is pulling back from near-record highs.
-
Bullish/Long-Term View: For long-term investors, a minor pullback of less than half a percent can be seen as normal and healthy market consolidation after a strong run-up. These investors might view this dip as a potential opportunity to add to their positions in the broader market at a slightly more favorable price, assuming their long-term outlook remains positive.
Opinion and Outlook
The immediate outlook for the S&P 500 suggests a period of consolidation or further pullback. The index is currently facing downward pressure, with sellers in control of the early session.
The key support level to watch for the remainder of the day is the intraday low of 6,248.22. A sustained break below this level could indicate more downside. On the other hand, for the market to regain a positive footing, it would need to reclaim the opening level around 6,259 and push higher. The market’s reaction around these key levels will provide clues about its direction for the rest of the trading day.
Frequently Asked Questions (FAQ)
1. What is the S&P 500 and what is it doing today?
The S&P 500 is a stock market index that represents the performance of 500 of the largest publicly traded companies in the U.S. Today, it opened lower and has been trading in negative territory, indicating a slight downturn in the broader market.
2. Why is the performance of the S&P 500 important?
It is widely considered the best gauge of large-cap U.S. equities and serves as a primary benchmark for the overall health of the U.S. stock market and the broader economy.
3. What does the chart indicate about today’s market trend?
The chart shows a bearish trend in the first hour of trading. The market opened lower, failed to rally, and then moved down to set a new intraday low, indicating selling pressure.
4. Can investors buy or sell the S&P 500 index directly?
No, you cannot buy or sell an index directly. However, investors can gain exposure to the S&P 500 by investing in financial products that track it, such as Exchange-Traded Funds (ETFs) like the SPDR S&P 500 ETF (SPY) or the Vanguard S&P 500 ETF (VOO), as well as index-based mutual funds and futures contracts.
5. What are the key price levels for the S&P 500 to watch today?
The key support level is the day’s low around 6,248.22. The primary resistance level is the previous day’s close of 6,279.35.
6. What does the 52-week range of the S&P 500 tell us?
The 52-week range shown is 4,835.04 – 6,284.65. With the previous close being just shy of the top of this range, it indicates the market has been in a strong uptrend over the past year and today’s dip is a pullback from a peak level.