SoFi Technologies, Inc. (ticker: SOFI) has become a major focus for investors today, as its stock price surged dramatically moments after the market opened, driven by a powerful wave of buying activity.
As of 10:10:59 AM EDT, the fintech company’s stock was trading at 0.63 or +3.39%. The move is even more impressive considering the stock’s previous close was $18.57.
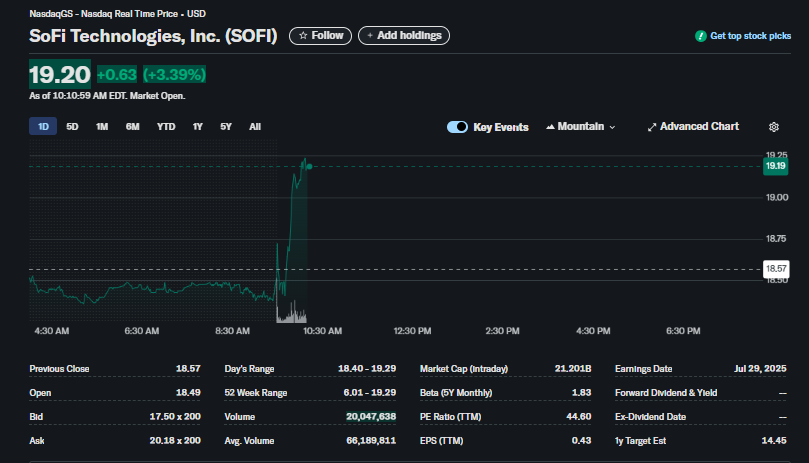
The intraday chart shows the stock was trading calmly in a narrow range during pre-market hours. However, at the 9:30 AM EDT opening bell, the price exploded vertically on exceptionally high volume. The stock shot up from its opening price of $18.49 to hit a new 52-week high of $19.29. This breakout to a new high is a significant technical event that often attracts further investor attention.
The trading volume was massive, with over 20 million shares trading hands within the first hour, indicating strong conviction behind the upward move.
Should You Buy or Sell the Stock Today?
The explosive price action in SOFI stock presents different scenarios depending on an investor’s strategy:
-
For Buyers/Momentum Traders: The powerful breakout to a new 52-week high on massive volume is a classic bullish signal. Traders who follow momentum may see this as a strong indication of further potential upside. The strength of the move suggests a significant positive catalyst may be at play.
-
For Sellers/Cautious Investors: Stocks that experience such a rapid, vertical price increase can be prone to pullbacks as early investors take profits. Additionally, the chart shows a 1-year analyst target estimate of $14.45, which the stock is currently trading well above. This could suggest to some that the stock is becoming overextended in the short term.
Opinion and Outlook
The immediate technical outlook for SoFi stock is strongly bullish. The breakout above the previous 52-week range is a powerful signal that buyers are in firm control. Such a significant move is typically driven by a major news event, a positive analyst rating change, or strong sector-wide momentum, which investors should investigate.
The new high of 18.57 will be the first area of potential support if the stock pulls back.
Frequently Asked Questions (FAQ)
1. What happened to SoFi (SOFI) stock today?
SoFi stock experienced a massive and sudden price surge immediately at the market open, gaining over 3% and hitting a new 52-week high.
2. What does it mean when a stock hits a new 52-week high?
Hitting a new 52-week high is generally a very bullish sign. It indicates that the stock has broken through all previous resistance levels from the past year and is in a strong uptrend, with positive investor sentiment.
3. Why is the high trading volume for SOFI significant?
The massive trading volume accompanying the price surge adds validity to the move. It shows that the breakout is supported by a large number of market participants, indicating strong interest and conviction rather than just a small-scale anomaly.
4. What are the key price levels to watch for SOFI stock?
The key resistance level is the new 52-week high of $19.29. A key support level to watch on any pullback would be the previous day’s close of $18.57.
5. How does SOFI’s current price compare to analyst estimates?
Based on the data in the image, the stock is currently trading at $19.20, which is significantly above the listed 1-year target estimate of $14.45.
6. Is now a good time to buy SOFI stock?
The decision to buy any stock depends on an individual’s financial situation, risk tolerance, and investment horizon. While the current momentum is strong, the rapid price increase also brings higher volatility. It is advisable to conduct your own research or consult with a financial advisor before making investment decisions.