Robinhood (HOOD) Stock Shows Resilience Near 52-Week High, Presenting Potential Opportunity for Investors
NEW YORK – In a dynamic day of trading, shares of Robinhood Markets, Inc. (NASDAQ: HOOD) are capturing significant investor attention. While the stock experienced a modest pullback, a broader look at its performance reveals a story of incredible growth and underlying financial strength, positioning the current price point as a potential strategic entry for discerning investors.
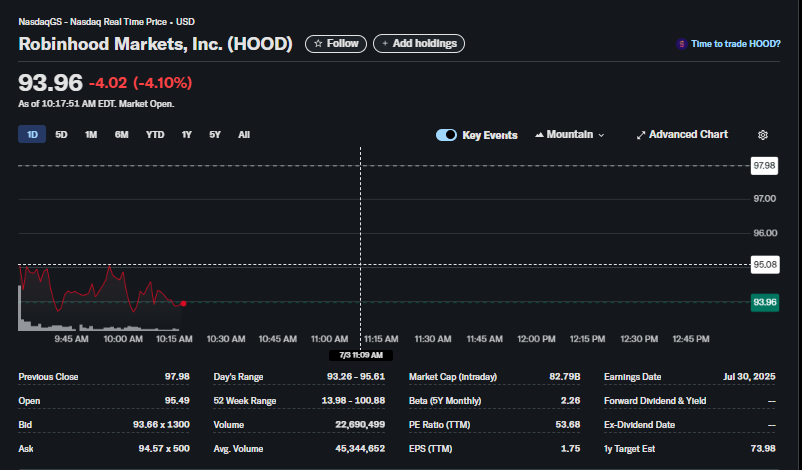
As of mid-morning, the HOOD stock price stood at $93.96. While this reflects a single-day dip, it’s crucial to view this figure within the larger context of the stock’s spectacular journey. Robinhood is currently trading near the top of its impressive 52-week range of $13.98 to $100.88. This climb represents a staggering multi-fold increase over the past year, rewarding long-term shareholders and cementing Robinhood’s status as one of the market’s top performers.
Financial analysts suggest that today’s price action is indicative of healthy market consolidation and profit-taking, a natural occurrence after such a powerful and sustained rally. The high trading volume, with over 22 million shares changing hands, underscores the continued and robust interest in the financial services platform.
Beyond the stock chart, the fundamental data for Robinhood paints a compelling picture of a healthy, profitable enterprise. The company boasts a substantial market cap of $82.79 billion, placing it firmly in the large-cap category. More importantly, Robinhood is profitable, with a positive trailing twelve-month EPS (Earnings Per Share) of $1.75.
This profitability is reflected in its P/E ratio of 53.68. While a higher P/E ratio can sometimes be a point of debate, in the case of a growth-oriented company like Robinhood, it often signals strong investor confidence in its future earnings potential and expansion capabilities. Investors are clearly willing to pay a premium for a piece of a company that has successfully transitioned to profitability while maintaining a trajectory of growth.
For those looking at the market today, the slight dip in Robinhood Markets’ stock may not be a sign of weakness, but rather a window of opportunity. It allows potential investors to acquire shares in a demonstrably strong and profitable company at a discount from its recent peak. The powerful year-long trend, combined with solid fundamentals like a positive EPS and a significant market position, provides a strong bullish case that transcends short-term market fluctuations. As the market continues to watch HOOD, the focus for many remains on its long-term potential and its remarkable performance over the last 52 weeks.
Frequently Asked Questions (FAQ)
1. What is the ticker symbol for Robinhood Markets, Inc.?
The ticker symbol for Robinhood Markets, Inc. on the Nasdaq exchange is HOOD.
2. What was the recent stock price for HOOD mentioned in the image?
As of 10:17:51 AM EDT, the stock price for Robinhood (HOOD) was $93.96, which represented a daily decrease of $4.02 (-4.10%).
3. Why might the Robinhood (HOOD) stock be considered a point of interest despite a daily dip?
Despite the single-day pullback, the stock is trading near its 52-week high of $100.88. This indicates a massive and sustained rally over the past year, making the current dip a potential point of interest for investors looking at the company’s long-term performance.
4. What is the 52-week price range for Robinhood stock?
The 52-week range for HOOD is $13.98 – $100.88. This wide range highlights the stock’s significant upward momentum over the last year.
5. Is Robinhood a profitable company based on the data?
Yes. The data shows a positive Earnings Per Share (EPS TTM) of $1.75 and a positive Price-to-Earnings (P/E Ratio TTM) of 53.68. These figures indicate that Robinhood Markets, Inc. has been profitable over the trailing twelve months.
6. What is the market capitalization of Robinhood?
The intraday market capitalization for Robinhood is approximately $82.79 billion, classifying it as a large-cap company with a significant presence in the market.
7. What does the high trading volume for HOOD suggest?
The volume for the day was over 22 million shares traded. High trading volume indicates a high level of investor interest and activity in the stock, which is a sign of a dynamic and closely-watched security.
8. What was the day’s trading range for HOOD stock?
The day’s trading range for Robinhood stock was between $93.26 and $95.61.
9. How does the current price compare to the previous day’s close?
The current price of 97.98**. This type of movement is often seen as market consolidation or profit-taking after a period of strong gains.
10. What is the analyst’s 1-year target estimate for HOOD?
The 1-year target estimate provided is $73.98. It’s important for investors to note that this is just one data point, and analyst targets can vary widely and are subject to frequent revision based on market conditions and company performance.
11. When is the next earnings date for Robinhood?
According to the provided data, the next earnings date for Robinhood is scheduled for July 30, 2025.