
As of 10:26 AM EDT, the Dow was trading at 44,642.98, down 185.55 points, or 0.41%. The index opened slightly below its previous close but showed signs of holding steady before a notable downturn began around 10:00 AM, leading it to its session lows.
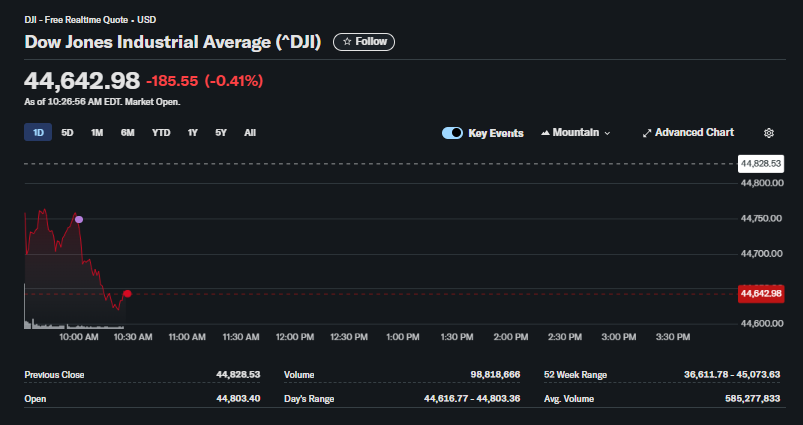
The intraday chart shows the Dow falling from an opening level near 44,803 to a low of 44,616.77. The move indicates a shift in market sentiment from cautious optimism to risk-off behavior within the first hour of the U.S. trading session.
Key Market Levels from the Chart:
-
Previous Close: 44,828.53
-
Day’s Range: 44,616.77 – 44,803.36
-
52-Week Range: 36,611.78 – 45,073.63
The key battle for the index today will likely be around the session low. A failure to hold this level could invite further selling, while a successful defense might lead to a potential recovery later in the day.
Market Outlook: What Does This Mean for Investors?
The movement of a major index like the Dow reflects the collective sentiment of investors towards 30 of the largest U.S. companies. Today’s action suggests caution. This analysis is for informational purposes and should not be considered investment advice.
The Bearish Perspective:
The clear downward trend after the first hour of trading suggests that sellers are currently in control. Investors may be reacting to overnight news, economic data, or simply taking profits after recent gains. The failure to hold the opening price range is a technically weak signal for the short term.
The Bullish Perspective:
Market dips can present buying opportunities for long-term investors. The index is still trading well within its recent range, and a morning dip is not uncommon. Buyers may step in around the current levels, viewing the pullback as a temporary reaction rather than the start of a sustained downturn. The market’s ability to find support at the day’s low (44,616.77) will be crucial for a potential rebound.
Our Opinion
The Dow Jones Industrial Average is on the defensive in early trading. The negative turn suggests that investor sentiment is fragile. The rest of the session’s direction will likely depend on whether the index can stabilize and build a base at these lower levels or if selling pressure intensifies.
Investors should monitor whether the Dow can reclaim the 44,700-44,800 range. A failure to do so could result in a test of lower support levels. As always, the market’s trajectory can be influenced by economic data releases and geopolitical events throughout the day.
Frequently Asked Questions (FAQ) about the Dow Jones
1. What is the Dow Jones Industrial Average (^DJI)?
The Dow Jones Industrial Average, often called “the Dow,” is a stock market index that represents the performance of 30 large, publicly-owned blue-chip companies trading on the New York Stock Exchange (NYSE) and the Nasdaq. It is one of the oldest and most-watched indices in the world.
2. Why is the Dow down today?
While the chart itself doesn’t state a specific reason, a decline in a major index like the Dow is typically caused by broad market factors. This can include disappointing economic data, concerns about inflation or interest rates, geopolitical tensions, or poor earnings reports from one of its influential component companies.
3. What does the Dow’s performance tell us about the broader stock market?
Because the Dow is composed of 30 major industrial and economic leaders, its performance is often seen as a barometer for the health of the overall U.S. economy and stock market. A falling Dow generally indicates negative sentiment among investors.
4. Can you buy or sell the Dow Jones Industrial Average directly?
You cannot invest directly in the Dow Jones Industrial Average itself, as it is just a mathematical measurement. However, investors can gain exposure to its performance by buying an Exchange-Traded Fund (ETF) like the SPDR Dow Jones Industrial Average ETF (DIA) or through mutual funds and futures that track the index.
5. What are the key price levels to watch for the Dow today?
Based on the chart, the key support level to watch is the day’s low of 44,616.77. A break below this could signal more selling. Key resistance levels are the day’s high of 44,803.36 and the previous close of 44,828.53. A move above these levels would indicate a bullish reversal.