
This morning, the NASDAQ Composite Index, a key benchmark for the technology sector, is showing signs of indecision among investors. As of 10:26 AM EDT, the index was trading at 20,504.68, a decline of 96.42 points (-0.47%).
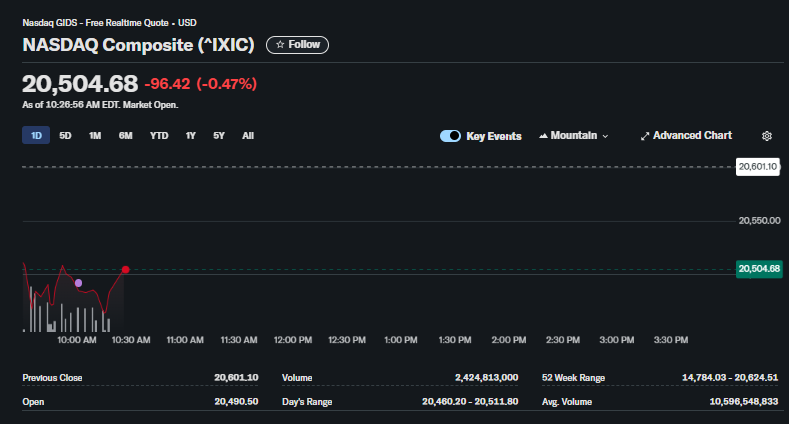
The intraday chart reveals a volatile first hour of trading. The index opened at 20,490.50, significantly below the previous day’s close of 20,601.10. It then dipped to a session low of 20,460.20 before mounting a recovery. This “W-shaped” price action in the morning indicates a tug-of-war between buyers and sellers, with neither side establishing clear dominance.
The index is currently trading near its 52-week high, a level where markets can often become susceptible to profit-taking and increased volatility. Investors will be closely watching to see if the morning’s lows hold as a support level or if selling pressure re-emerges.
Market Direction: Bullish or Bearish Today?
Given the choppy price action, the immediate direction of the NASDAQ is uncertain. Here’s how different market participants might interpret the current situation:
-
The Bullish View: Bulls will be encouraged by the rebound from the morning’s low. If the index can continue this upward momentum and break through the session’s high of 20,511.80, it could signal that buyers are taking control and that the initial sell-off was a temporary dip.
-
The Bearish View: Bears will point to the lower open and the failure to sustain an early rally. If the current upward move falters before reaching new highs for the day, it could be seen as a sign of weakness, potentially leading to a re-test of the lows around 20,460.20.
Conclusion: The market is currently at a standstill. The next significant move above the daily high or below the daily low will likely set the tone for the remainder of the trading session. Traders should be prepared for continued volatility.
Analyst Opinion
The NASDAQ Composite’s behavior this morning reflects broad market uncertainty. After a long run-up to near all-time highs, it’s natural to see some consolidation or profit-taking. The back-and-forth price action indicates that investors are weighing various economic factors and corporate outlooks without strong conviction in either direction. The rest of the day will be a test of whether the dip-buyers have enough strength to reverse the early negative sentiment.
Frequently Asked Questions (FAQ)
1. What is the NASDAQ Composite Index (^IXIC)?
The NASDAQ Composite is a major stock market index that includes almost all of the stocks listed on the Nasdaq stock exchange. It is heavily weighted toward technology and high-growth companies.
2. Why is the NASDAQ down today based on the chart?
The chart shows that the index opened lower than its previous close and experienced selling pressure in the first hour of trading. While it is attempting a rebound, it has not yet recovered its initial losses, reflecting overall negative sentiment at the market open.
3. What are the key price levels for the NASDAQ today?
Based on the image, the key support level is the day’s low at 20,460.20. The primary resistance level is the day’s high at 20,511.80, with the previous close of 20,601.10 also acting as a significant resistance point.
4. What does the “W-shaped” pattern in the chart mean?
A choppy, W-shaped pattern at the open often indicates significant indecision in the market. It shows that an initial sell-off was met by strong buying, which was then met by renewed selling, leading to a volatile but range-bound environment.
5. How can an individual invest in or trade the NASDAQ Composite?
Since you cannot buy an index directly, investors often use Exchange-Traded Funds (ETFs) that are designed to track its performance. A popular example is the Invesco QQQ Trust (ticker: QQQ), which tracks the NASDAQ-100 index (the 100 largest non-financial companies in the NASDAQ Composite).