
NEW YORK, NY – Wall Street’s tech-heavy NASDAQ Composite (^IXIC) kicked off the trading day with a powerful surge, demonstrating robust investor confidence and setting a positive tone for the market. The index climbed to 20,252.15, a solid gain of +49.26 (+0.24%), just 20 minutes after the Market Open.
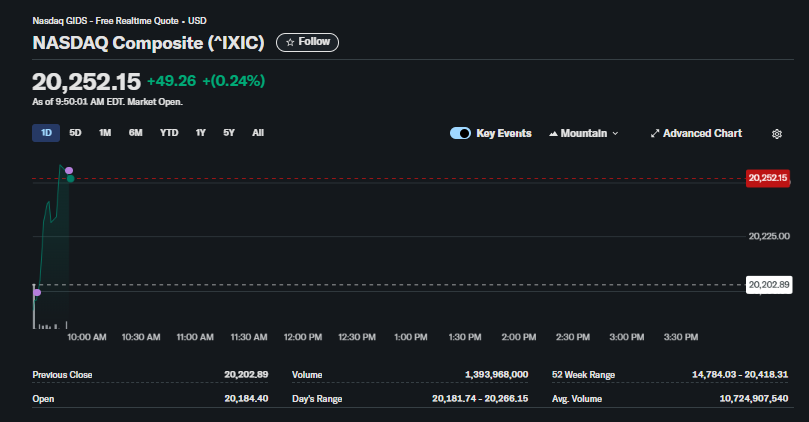
The morning session was characterized by a significant upward spike right at the opening bell. After opening slightly below its previous close, the index immediately rallied, a clear indication of strong buying interest across the technology sector. This bullish sentiment was backed by impressive Volume, with nearly 1.4 billion shares changing hands early in the day, reflecting high participation and conviction from investors.
The index is currently trading near the top of its Day’s Range of 20,181.74 – 20,266.15, moving well above the Previous Close of 20,202.89. This strong performance pushes the NASDAQ Composite (^IXIC) closer to its 52 Week Range high of 20,418.31. Trading near a 52-week peak is often seen by market analysts as a sign of underlying strength and sustained momentum.
Today’s positive action for the NASDAQ Composite, a bellwether for the tech industry and growth stocks, suggests that investor appetite for innovation and forward-looking companies remains strong. The decisive move into positive territory sets an optimistic stage for the rest of the trading day.
Frequently Asked Questions (FAQ) about the NASDAQ Composite (^IXIC)
Here are answers to some common questions based on the provided market data.
1. What is the NASDAQ Composite (^IXIC)?
The NASDAQ Composite (^IXIC) is a major stock market index that includes almost all of the stocks listed on the Nasdaq stock exchange. It is widely followed as an indicator of the performance of the technology sector and high-growth companies.
2. What was the value of the NASDAQ Composite in the image?
At the time the image was captured, the value of the NASDAQ Composite was 20,252.15.
3. How was the NASDAQ performing at that moment?
The index was performing positively, showing a gain of +49.26 points, which translates to an increase of +0.24%.
4. What time was this market data from?
The data was captured “As of 9:50:01 AM EDT. Market Open.”
5. What was the day’s trading range for the NASDAQ Composite?
The Day’s Range was from a low of 20,181.74 to a high of 20,266.15 up to that point in the day.
6. What was the previous day’s closing value?
The Previous Close for the NASDAQ Composite was 20,202.89.
7. How did the index open compared to its previous close?
The index opened at 20,184.40, which was slightly below the previous close, but it rallied strongly immediately after the 9:30 AM market open.
8. What does the trading volume indicate?
The Volume of 1,393,968,000 shares traded so early in the session indicates very high market activity and strong investor participation.
9. What is the 52-week range for the NASDAQ Composite?
The 52 Week Range is between 14,784.03 (the low) and 20,418.31 (the high).
10. Is the NASDAQ currently trading near its 52-week high?
Yes. With a current value of 20,252.15 and a 52-week high of 20,418.31, the index is trading very close to its peak for the year, which is generally considered a bullish signal of market strength.
11. What does the green color for the price change mean?
The green color signifies that the index has gained value and is trading at a higher level than its closing price from the previous trading day.