
NEW YORK, NY – In a volatile morning session on the Nasdaq, Tesla, Inc. (TSLA) demonstrated remarkable resilience, showcasing strong investor confidence as its stock price staged an impressive rebound after an initial dip at the Market Open. The electric vehicle giant’s stock became the center of a flurry of activity, signaling to many that dips are seen as opportunities by steadfast investors.
Shortly after the opening bell, Tesla, Inc. (TSLA) experienced a significant downturn, a move that tested the market’s resolve. However, the narrative quickly shifted from one of decline to one of strength. After touching a day’s low of 293.21, the stock mounted a vigorous comeback, climbing back above the critical $300 mark to a price of 301.88. This sharp recovery highlights a robust floor of support and a wave of buyers stepping in at what they perceive to be an attractive entry point.
The trading session was marked by exceptionally high Volume, with over 40.5 million shares changing hands shortly after the market opened. This heavy trading volume underscores the intense interest surrounding Tesla stock and indicates that for every seller, there was an eager buyer ready to acquire shares. This level of engagement is often interpreted as a sign of a healthy, liquid market for the stock and strong conviction from its investor base.
For long-term believers in Tesla’s vision, this morning’s price action offered a textbook “buy the dip” scenario. While the stock opened significantly lower than its Previous Close of 317.66, the subsequent rebound suggests a rejection of lower prices. This dynamic is familiar to seasoned Tesla investors, who are accustomed to the stock’s volatility, which is also reflected in its 52 Week Range of 182.00 – 488.54. The ability to purchase shares at a discount to recent highs is often a key strategy for those bullish on the company’s future in electric vehicles, artificial intelligence, and renewable energy.
Further bolstering investor optimism is the 1y Target Est from market analysts, which stands at 306.07. This consensus estimate suggests that Wall Street professionals, on average, anticipate the stock price will rise from its current levels over the next 12 months. This forward-looking projection provides a crucial data point that many use to look past short-term intraday swings.
In conclusion, while the initial headline numbers showed a drop, the underlying story for Tesla today is one of resilience, high investor engagement, and a powerful rebound. The quick recovery from the Day’s Range low demonstrates that conviction in the TSLA growth story remains firmly intact, with many seeing today’s volatility not as a setback, but as a strategic opportunity.
Frequently Asked Questions (FAQ) about Tesla (TSLA) Stock
Here are answers to some common questions based on the provided market data.
1. What was the stock price of Tesla (TSLA) in the image?
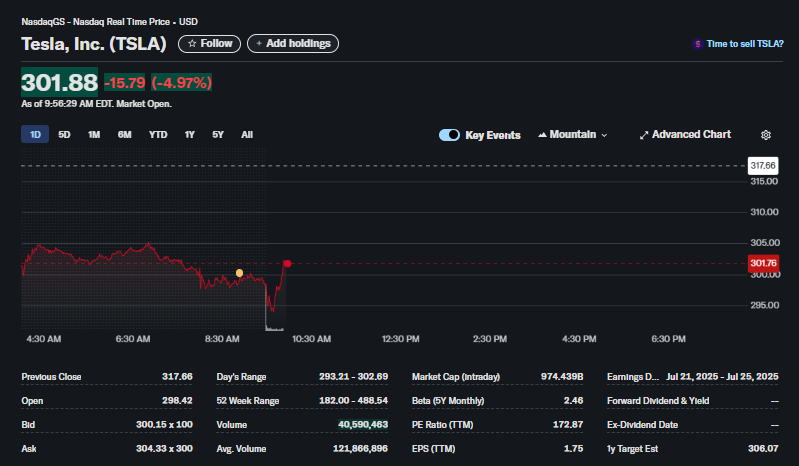
The real-time stock price of Tesla, Inc. (TSLA) was $301.88 at the time the screenshot was taken (9:56:29 AM EDT).
2. Why did the Tesla stock price drop at the market open?
The stock opened at $298.42, which was significantly lower than the Previous Close of $317.66. While the image doesn’t state a specific reason, such drops can be caused by broader market trends, sector-wide news, or pre-market trading sentiment.
3. Is the rebound in the TSLA stock a positive sign?
Many analysts and investors view a strong rebound from a low as a positive sign. It indicates that buyers stepped in to purchase the stock at lower prices, suggesting confidence in the company and preventing it from falling further.
4. What was the day’s trading range for Tesla stock?
According to the image, the Day’s Range was between
293.21∗∗(thelow)and∗∗293.21** (the low) and **
302.69 (the high) up to that point in the trading day.
5. What does the high trading volume for TSLA indicate?
A high Volume of 40,590,463 shares so early in the day signifies a very high level of interest and activity in the stock. It means many shares are being bought and sold, which can contribute to price volatility but also shows strong investor engagement.
6. What is the 1-year analyst target estimate for Tesla’s stock?
The 1y Target Est for TSLA is $306.07. This is the average price target from financial analysts who cover the stock, suggesting they collectively see a modest upside from the current price over the next year.
7. How does the current price compare to the previous day’s close?
The current price of $301.88 is down $15.79 (-4.97%) from the Previous Close of $317.66.
8. What is the 52-week range for TSLA, and what does it tell us?
The 52 Week Range is $182.00 – $488.54. This shows the lowest and highest prices the stock has traded at over the past year. It provides context for the current price and highlights the stock’s volatility.
9. Should I buy Tesla stock on a dip?
Viewing a price dip as a buying opportunity is a common investment strategy. However, whether it’s the right move depends on an individual’s financial goals, risk tolerance, and belief in the company’s long-term prospects. This article does not constitute financial advice, and you should consult with a financial professional before making investment decisions.
10. What exchange is Tesla (TSLA) traded on?
Tesla, Inc. (TSLA) is traded on the NasdaqGS, which stands for the Nasdaq Global Select Market.
11. What does Beta mean for a stock like Tesla?
The image shows a Beta of 2.46. Beta measures a stock’s volatility relative to the overall market (which has a beta of 1.0). A beta above 1, like Tesla’s, indicates the stock is more volatile than the market. A beta of 2.46 suggests it’s historically been 146% more volatile than the market average.
12. What does P/E Ratio (TTM) mean?
The P/E (Price-to-Earnings) Ratio (TTM – Trailing Twelve Months) of 172.87 is a valuation metric. It compares the company’s current stock price to its earnings per share over the last 12 months. A high P/E ratio, like Tesla’s, often indicates that investors expect high future growth.