NEW YORK – Shares of Robinhood Markets, Inc. (NASDAQ: HOOD) experienced a dramatic surge at the market open today, catapulting over 5% and smashing its previous 52-week high. The fintech giant’s stock showed remarkable strength and investor confidence, driven by exceptionally high trading volume that points to a significant bullish sentiment in the market.
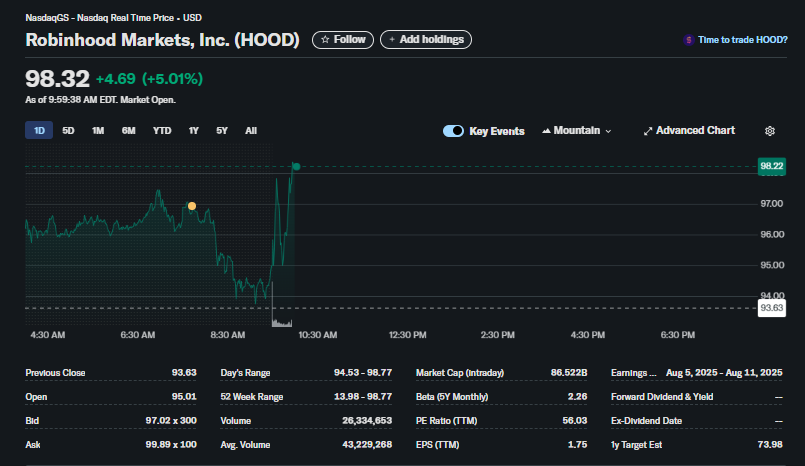
As of 9:59 AM EDT, HOOD stock was trading at an impressive $98.32, marking a substantial gain of $4.69, or 5.01%, for the day. This powerful opening pushed the stock to a new 52-week high, with the day’s range hitting $98.77, a clear indicator of the strong upward momentum. The stock opened at $95.01, well above its previous close of $93.63, and immediately began its climb.
A key driver behind this remarkable performance is the massive investor interest, evidenced by the trading volume. In just the first 30 minutes of the trading session, over 26.3 million shares had already changed hands. This figure represents a significant portion of its average daily volume of 43.2 million, signaling an unusually high level of activity and a strong conviction among buyers. This surge lifted Robinhood’s intraday market capitalization to over $86.5 billion.
Perhaps one of the most compelling aspects of this rally is that the current stock price has significantly outpaced analyst expectations. The current price of $98.32 has soared past the listed 1-year target estimate of $73.98. This suggests that recent performance and future outlook have led investors to re-evaluate the company’s worth at a much higher premium than previously anticipated.
While the specific catalyst for today’s surge is not immediately apparent, the price action reflects a renewed and vigorous optimism surrounding the fintech sector and Robinhood’s position within it. The stock is now trading at the very top of its 52-week range of $13.98 – $98.77, representing a monumental recovery and growth trajectory over the past year.
Market watchers will now be closely observing if Robinhood’s stock price can sustain these levels and potentially break the psychologically important $100 barrier. With its high Beta of 2.26, indicating higher volatility than the broader market, and a P/E ratio of 56.03, investors are clearly betting on significant future growth. Today’s performance solidifies Robinhood’s status as a closely-watched name on the Nasdaq.
Frequently Asked Questions (FAQ) about Robinhood (HOOD) Stock
Here are answers to common questions based on the provided market data.
1. What is the current stock price for Robinhood?
As of 9:59:38 AM EDT, the stock price for Robinhood Markets, Inc. (HOOD) was $98.32.
2. How much did Robinhood stock increase today?
The stock increased by $4.69, which is a gain of 5.01% from its previous close.
3. What is the stock ticker symbol for Robinhood?
The ticker symbol for Robinhood Markets, Inc. is HOOD, and it trades on the Nasdaq.
4. What is the 52-week high for HOOD stock?
The 52-week high for the stock is $98.77, which was reached during the current trading day.
5. How does the current price compare to its 52-week range?
The current price of $98.32 is at the very top of its 52-week range of $13.98 – $98.77.
6. What was the trading volume for Robinhood this morning?
As of 9:59 AM, the trading volume was 26,334,653 shares.
7. How does today’s volume compare to the average?
The morning’s volume is already more than half of the average volume of 43,229,268, indicating very high trading activity.
8. What is the market capitalization of Robinhood?
The intraday market cap for Robinhood is approximately $86.522 billion.
9. What is the 1-year target estimate for HOOD stock?
The 1-year target estimate provided is $73.98, which the stock is currently trading well above.
10. What was Robinhood’s opening price today?
The stock opened for trading at $95.01.
11. What is Robinhood’s P/E Ratio?
According to the data, the Price-to-Earnings (P/E) Ratio (TTM) for Robinhood is 56.03.
12. Is Robinhood paying a dividend?
Based on the provided image, the “Forward Dividend & Yield” and “Ex-Dividend Date” fields are marked with a dash, indicating that the company does not currently pay a dividend.